Average Car Mileage UK (2026)
Average Car Mileage UK
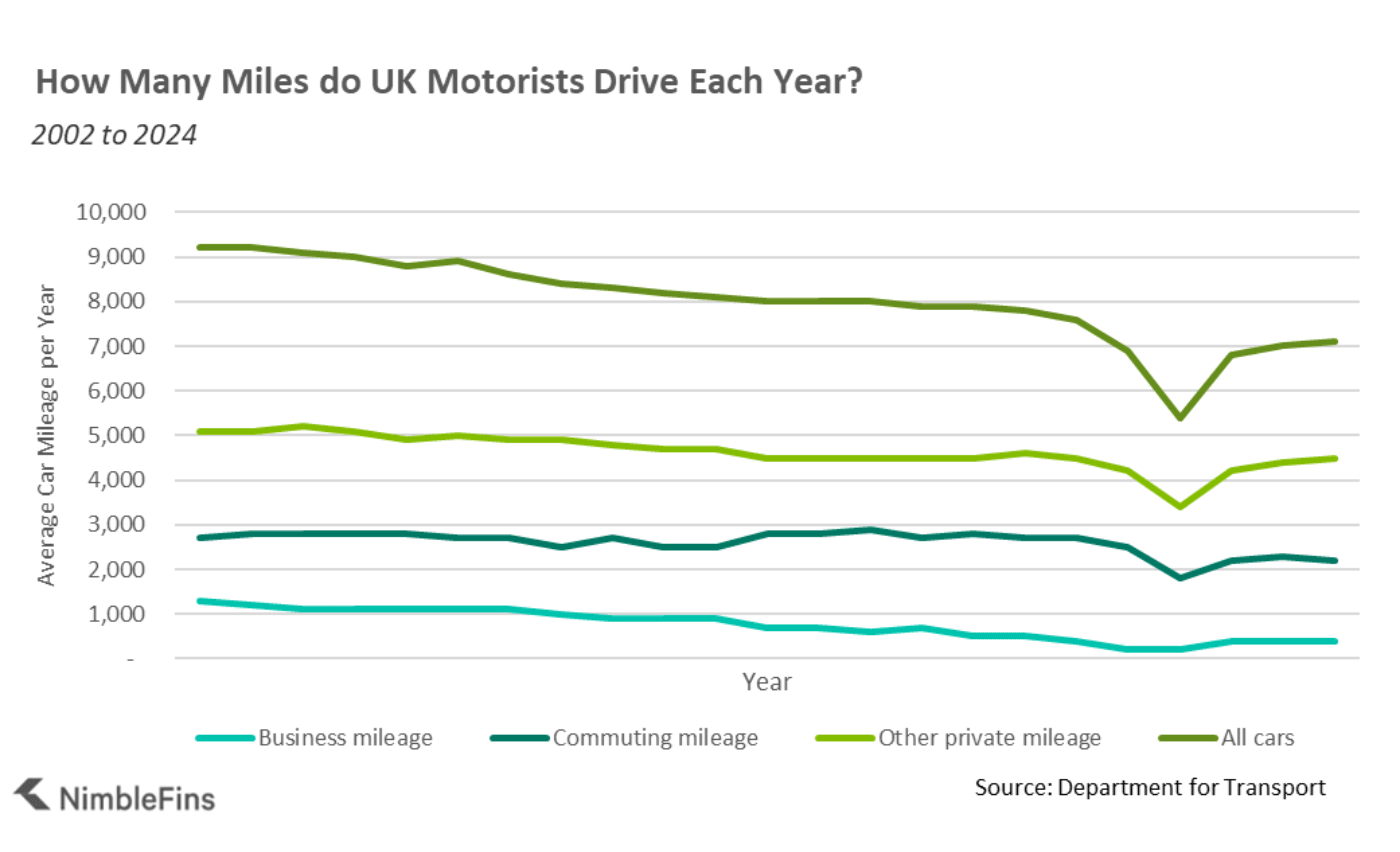
The latest data available in January 2026 showed that the average car in the UK drives 7,100 miles per year—down 22% from 9,100 miles in 2004. British motorists drive less now, primarily driven by a drop in business driving and private driving. This data reflects 2024 driving.
Commuting mileage had held pretty steady at around 2,700 miles a year on average per car from 2002 to 2019, but has been noticeably lower since the pandemic, hovering around 2,200-2,300 for the past few years. Not surprisingly, commuting and business miles were impacted the most by the pandemic lockdown; private miles less so.
But overall, there is a LOT less business driving nowadays. In the 20 years from 2004 to 2024, business mileage plummeted 64% from 1,100 to 400 miles per year.
| Change in UK Driving Habits | Business Miles | Commuting Miles | Other Private Miles | Total Miles |
|---|---|---|---|---|
| 2004 | 1,100 | 2,800 | 5,200 | 9,100 |
| 2024 | 400 | 2,200 | 4,500 | 7,100 |
| Change | -64% | -21% | -13% | -22% |
The average car journey for cars in the UK is 8.1 miles long.
During a time when cars are being driven less and less, it's interesting to note that the number of cars licensed in the UK has continued to rise steadily—so while the mileage per car has dropped, you could argue that as a country we are driving more. That's why you might feel like there are more cars on the road than ever, despite the lower per car mileage figures shown here.
Average Mileage per Day, Week, Month and Year
Wondering how far Brits typically drive every day, week or month? Cars in the UK drive an average of 19 miles a day, which is equivalent to 137 miles a week, 592 miles a month and 7,100 miles a year—still significantly below pre-pandemic levels.
| Average Car Mileage per Day, Week, Month and Year | 2019 | 2020 | 2021 | 2022 | 2023 | 2024 |
|---|---|---|---|---|---|---|
| Per Day | 21 | 19 | 15 | 19 | 19 | 19 |
| Per Week | 146 | 133 | 104 | 131 | 135 | 137 |
| Per Month | 633 | 575 | 450 | 567 | 583 | 592 |
| Average Total Miles per car | 7,600 | 6,900 | 5,400 | 6,800 | 7,000 | 7,100 |
Calculating your own annual car mileage
If you want to calculate how much you drive a year (perhaps you're trying to figure out how many miles to declare on your car insurance), use this calculator or the table below to get an idea of your annual mileage based on your daily, weekly or mileage driving habits:
Mileage Calculator
Mileage Calculator
Results:
How Much do You Drive a Year? Mileage Calculations
| Daily mileage | = Weekly mileage | = Monthly mileage | = Annual mileage |
|---|---|---|---|
| 10 | 70 | 305 | 3,650 |
| 15 | 105 | 458 | 5,475 |
| 20 | 140 | 610 | 7,300 |
| 25 | 175 | 763 | 9,125 |
| 30 | 210 | 915 | 10,950 |
| 35 | 245 | 1,068 | 12,775 |
| 40 | 280 | 1,220 | 14,600 |
| 45 | 315 | 1,373 | 16,425 |
| 50 | 350 | 1,525 | 18,250 |
| 55 | 385 | 1,678 | 20,075 |
| 60 | 420 | 1,830 | 21,900 |
| 65 | 455 | 1,983 | 23,725 |
| 70 | 490 | 2,135 | 25,550 |
But remember to include any longer trips such as visiting family or holidays when calculating your annual mileage for insurance purposes. You need to declare enough miles, or your car insurance company could invalid your policy—so it's better to overestimate than underestimate (but don't overestimate too much, higher mileage means a higher premium).
Average Car Mileage by Fuel Type
While the average UK car travelled 7,100 miles in 2024, those driving petrol cars drove 25% less on average compared to diesel cars. Diesel cars drove 8,300 miles on average (down from 9,400 in 2019), while petrol cars covered 6,200 miles in 2024 (down from 6,300 in 2019). This is not surprising as those who drive more tend to gravitate towards diesel cars due to better gas mileage, especially given that the average motorist spends over £1,000 a year on car fuel.
Hybrid and battery electric cars clock mileage figures closer to diesel cars, on average (~1,800-2,700 more miles a year than the typical petrol car).
| How Many Miles do UK Motorists Drive Each Year? | 2019 | 2020 | 2021 | 2022 | 2023 | 2024 |
|---|---|---|---|---|---|---|
| Petrol | 6,300 | 5,900 | 4,600 | 6,000 | 6,100 | 6,200 |
| Diesel | 9,400 | 8,400 | 6,500 | 7,900 | 8,300 | 8,300 |
| Hybrid | n/a | n/a | n/a | n/a | 8,300 | 8,000 |
| Battery Electric | n/a | n/a | n/a | n/a | n/a | 8,900 |
| Average | 7,400 | 6,800 | 5,300 | 6,600 | 7,000 | 7,100 |

Average Car Mileage by Gender
Men drive more miles per year than women. In older data, the National Travel Survey previously found that men travel 15% further (6,389 miles per person per year) compared to women (5,576 miles per person per year). This is one reason that car insurance for women is cheaper on average than for men.
Why You Should Track Your Annual Car Mileage
Having a good understanding of your annual mileage is more important that you might think. Car insurance quotes and contracts are based upon a certain estimated mileage and if you go over that, a claim that might otherwise be valid might be denied. To some extent this is a reasonable position on the part of car insurance companies, because the more you drive the higher the odds of an accident and associated insurance claims. Insurance companies charge higher rates for cars that drive more, and expect car owners to pay for the risk they present.